Innovasjon i Europa: statusrapport 2024
Rapport lagt fram av Kommisjonen 8.7.2024 med pressemelding
Bakgrunn
BAKGRUNN (fra Kommisjonens pressemelding 8.7.2024)
Europe's innovation performance steadily improving but at different speeds between Member States
The innovation performance of the European Union continues to improve at a steady pace, reaching a 10% increase since 2017 and a growth of 0.5% between 2023 and 2024. According to the 2024 edition of the European Innovation Scoreboard (EIS) published today, most EU Member States have boosted their innovation performance, but the increase varies strongly from one to another.
Key findings
Between 2023 and 2024, the national innovation performance has increased for 15 Member States, while it has declined for another group of 11. Croatia remained stable. Compared to the last edition:
- Denmark remains the most innovative EU country followed by Sweden, which led the rankings between 2017-2022.
- Two countries now belong to a different performance group. Estonia became a Strong Innovator following a steady growth pattern since 2017. Belgium, which was an Innovation leader in 2023, moved down to the Strong Innovators' category, although it maintained its fifth position in the rankings overall.
A broader analysis, including other European countries and selected global competitors, shows a changing international landscape. Switzerland is the most innovative European country and South Korea remains the most innovative global competitor in 2024, while China has surpassed Japan and is progressively closing the gap with the EU.
In the global context, the EU maintains a robust position, demonstrating strong performance in most indicators including in SMEs introducing product and process innovations and environment-related technologies. The EU still faces challenges compared to its main global competitors in areas such as intellectual assets, collaboration among innovative SMEs and R&D expenditure in the business sector.
Figure 3: Innovation performance compared to the EU 2017 among EU 27 Member States – A comparison to 2023.
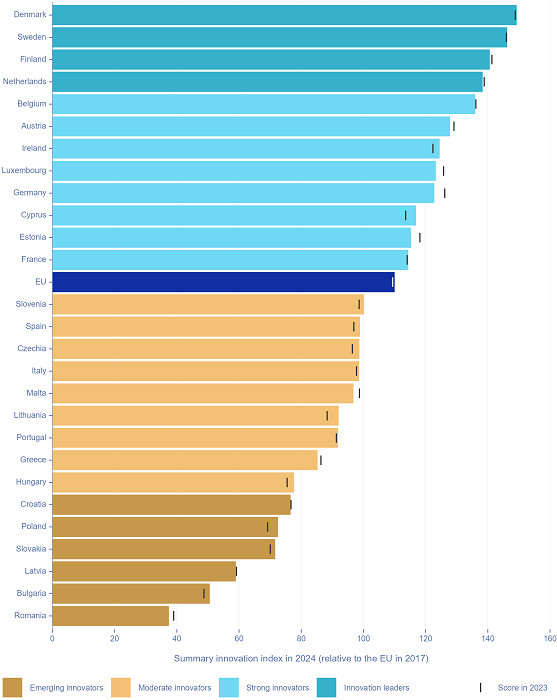
The Innovation Leaders have particularly attractive research systems and are strong in digitalisation. The Strong Innovators demonstrate significant strengths in their innovation ecosystems (product and business innovations). Among the Moderate Innovators, there is a range of positive trends, in particular the development of collaboration in research; whereas Emerging Innovators have shown an overall positive trajectory in innovation performance, but they are still lagging.
Although the performance differences have slightly narrowed among the Strong Innovators and Moderate Innovators between 2017 and 2024, they became more pronounced among the Innovation Leaders and Emerging Innovators. There are also persistent geographic differences in innovation performance, with Innovation Leaders and most Strong Innovators predominantly located in Northern and Western Europe, and many of the Moderate and Emerging innovators in Southern and Eastern Europe.
Background
The European Innovation Scoreboard (EIS) is an annual publication by the European Commission that provides a comparative assessment of the innovation performance of EU Member States, neighbouring European countries and selected global competitors. The EIS is based on 32 indicators covering the economy, business and entrepreneurship, innovation profiles, governance and policy framework, climate change and demography.
The EIS 2024 covers all EU Member States, 12 neighbouring European countries including Moldova for the first time and, with a smaller set of indicators, 11 global competitors. The EIS 2024 categorises Member States in four innovation groups based on their scores:
- Innovation Leaders (performance is above 125% of the EU average),
- Strong Innovators (between 100% and 125% of the EU average),
- Moderate Innovators (between 70% and 100% of the EU average) and
- Emerging Innovators (below 70% of the EU average).
The scoreboard aims to support policymakers, researchers, and stakeholders in understanding the innovation landscape, finding strengths and weaknesses, and formulating evidence-based policies to enhance innovation across Europe.
The EIS 2024 is accompanied by an updated and revamped interactive tool which offers customised comparisons visualising country profiles and showcasing relative strengths, weaknesses and trends, as well as exploring correlations between indicators.
The New European Innovation Agenda, launched in 2022, is key to bridging the innovation gap by accelerating the development of cutting-edge technologies and fostering a dynamic environment for startups and established businesses throughout Europe. Substantial efforts have been made in carrying forward initiatives under the Agenda's key priorities, such as implementing new directives in the financial sector, introducing new mechanisms and funds to encourage venture capital, and providing training opportunities for deep tech talent.
More information
European Innovation Scoreboard (EIS) 2024
European Innovation Scoreboard 2024– Executive summary
Questions and Answers on the European Innovation Scoreboard (EIS) 2024
EIS 2024 – Annex B (performance per indicator)